| |
|
| Browse | Ask | Answer | Search | Join/Login |
|
|
||||
|
Normal distribution
On the same diagram sketch three normal distributions, one with mean 0 and standard deviation 2, one with mean 0 and standard deviation 4, and one with mean 3 and standard deviation 2. Make sure that you label each of the three graphs.
I do not understand how I am supposed to do this, can someone please help me. |
||||
|
||||
|
Have you ever seen a normal distribution curve? This one is a good one: 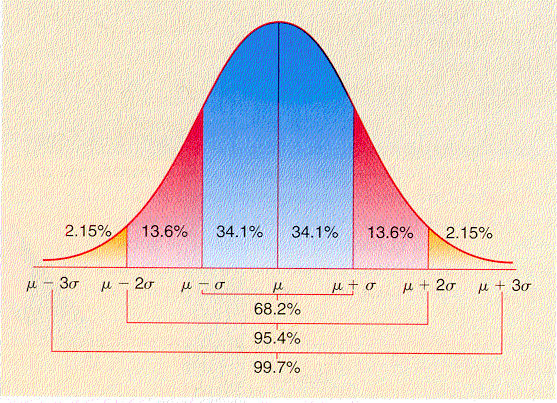 The line at the bottom gives the values where The blue areas denote the first standard deviations (denoted by The red areas denoted the second standard deviations and the orange the third standard deviations, where the curve is very close to the horizontal line. a) If the mean is 0, then replace From the mean towards the right, From the mean towards the left, Is that clear enough? Remember that the curve should be symmetric about the mean, the curve is very near to the horizontal line at 3 standard deviations. |
||||

|
||||
|
|
||||
| Question Tools | Search this Question |


Add your answer here.
Check out some similar questions!
A politician wants to know what percentage of the voters support her position pn the issue of forced busing for integration. What size voter sample should be obtained to determine with 90 % confidence the support level to within 4%? Given that 10% of the nails using a certain manufacturing...
I am analyzing stock returns in a time series. Some values are negative and other positive. While skewness in a normal distribution is = 0, the normal seems to be the most suitable because it allows negative values. I end up with a positively skewed distribution. Lognormals and betha distribution...
for a normal distribution problem: mean = 100 standard deviation = 10 80% of the values are between what 2 x values symmetrically distributed around the mean. How can you find the answer?
View more questions Search

|
